

 In many cases, only the time series at the lowest level of the
hierarchies (bottom time series) are available.
In many cases, only the time series at the lowest level of the
hierarchies (bottom time series) are available. HierarchicalForecast
has tools to create time series for all hierarchies and also allows you
to calculate prediction intervals for all hierarchies. In this notebook
we will see how to do it.
Aggregate bottom time series
In this example we will use the Tourism dataset from the Forecasting: Principles and Practice book. The dataset only contains the time series at the lowest level, so we need to create the time series for all hierarchies.
The dataset can be grouped in the following strictly hierarchical
structure.
aggregate function from HierarchicalForecast we can get
the full set of time series.
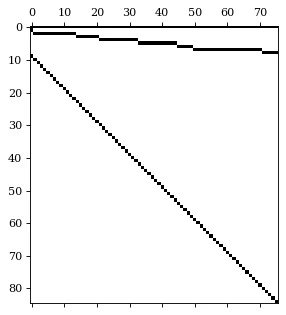
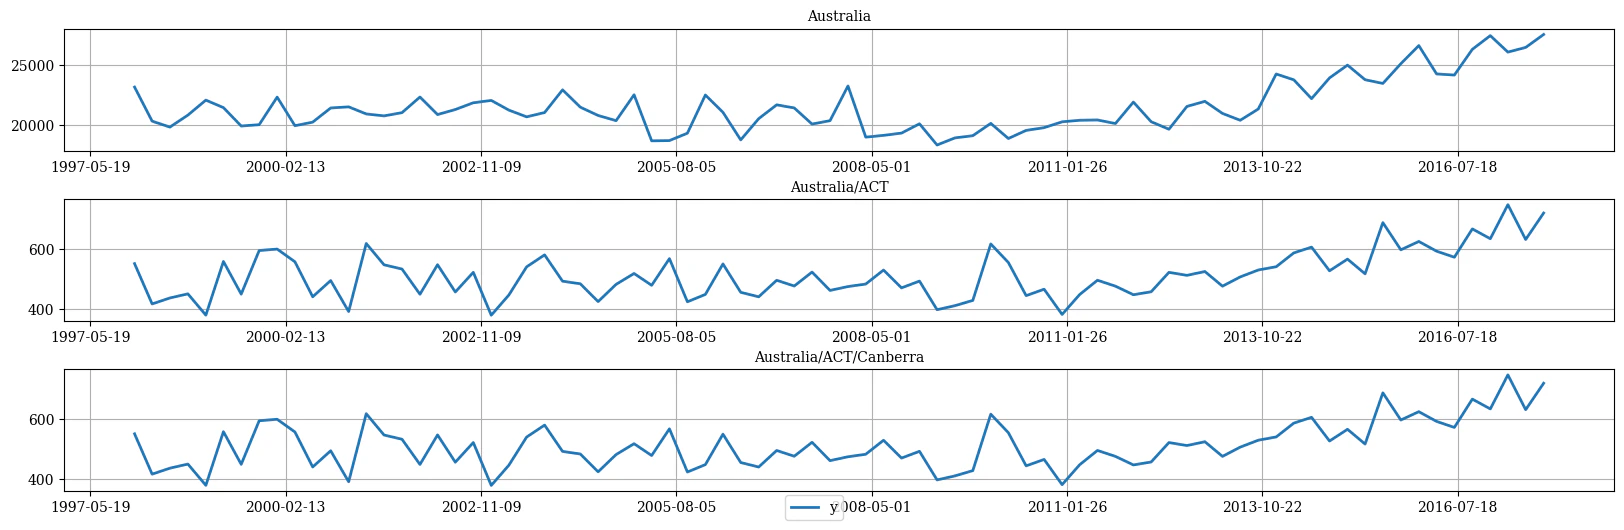
S matrix and the data using the
HierarchicalPlot class as follows.
Split Train/Test sets
We use the final two years (8 quarters) as test set.Computing base forecasts
The following cell computes the base forecasts for each time series inY_df using the AutoARIMA and model. Observe that Y_hat_df
contains the forecasts but they are not coherent. To reconcile the
prediction intervals we need to calculate the uncoherent intervals using
the level argument of StatsForecast.
Reconcile forecasts and compute prediction intervals using PERMBU
The following cell makes the previous forecasts coherent using theHierarchicalReconciliation class. In this example we use BottomUp
and MinTrace. If you want to calculate prediction intervals, you have
to use the level argument as follows and also
intervals_method='permbu'.
Y_rec_df contains the reconciled forecasts.
Plot forecasts
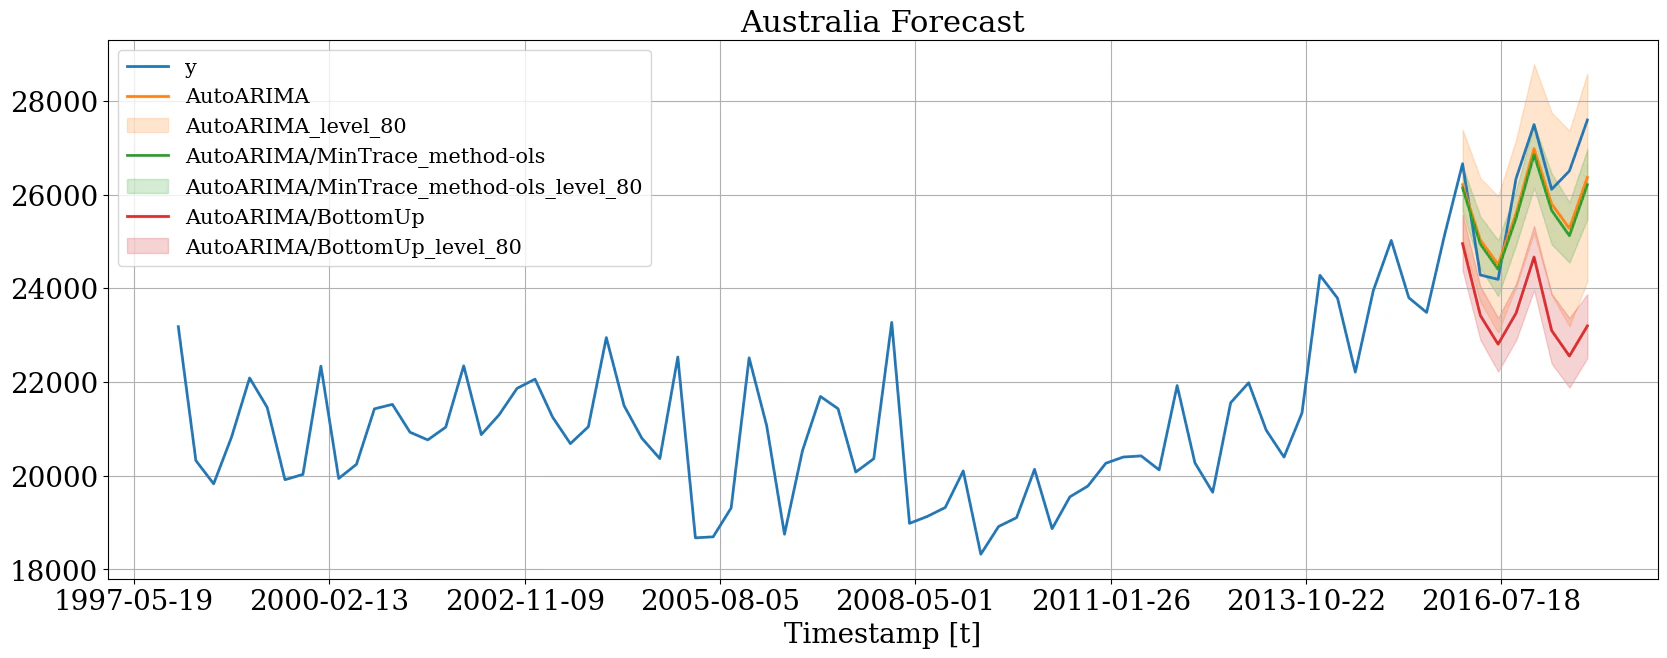
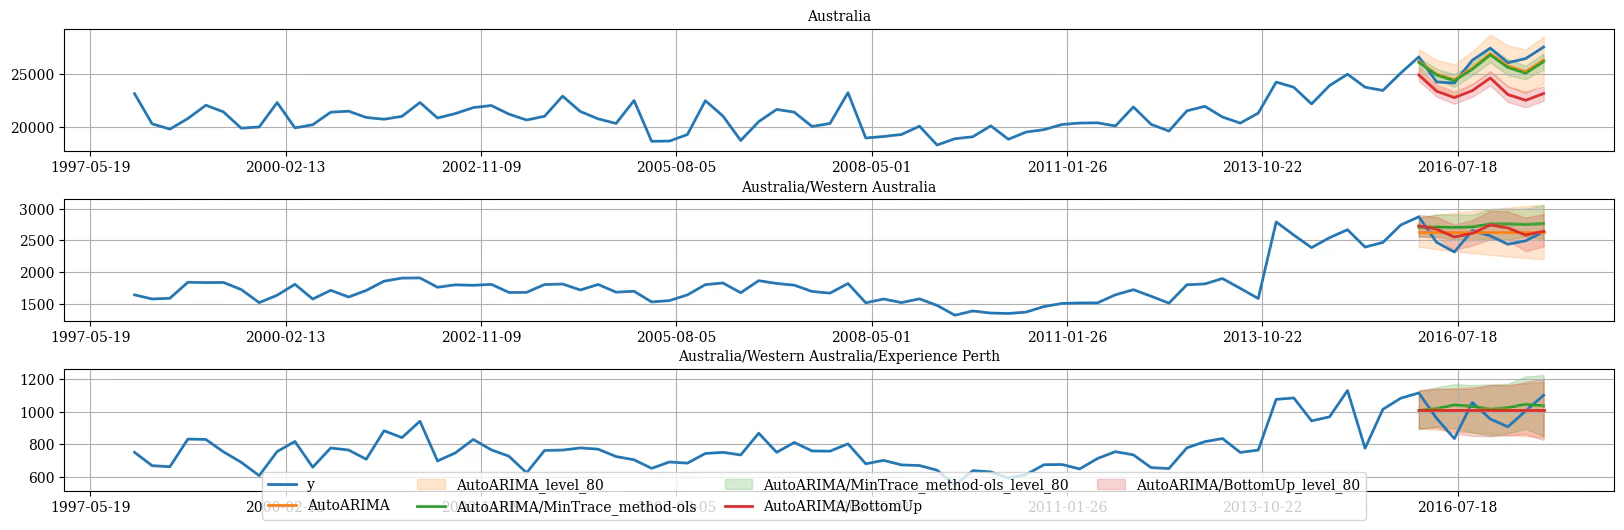
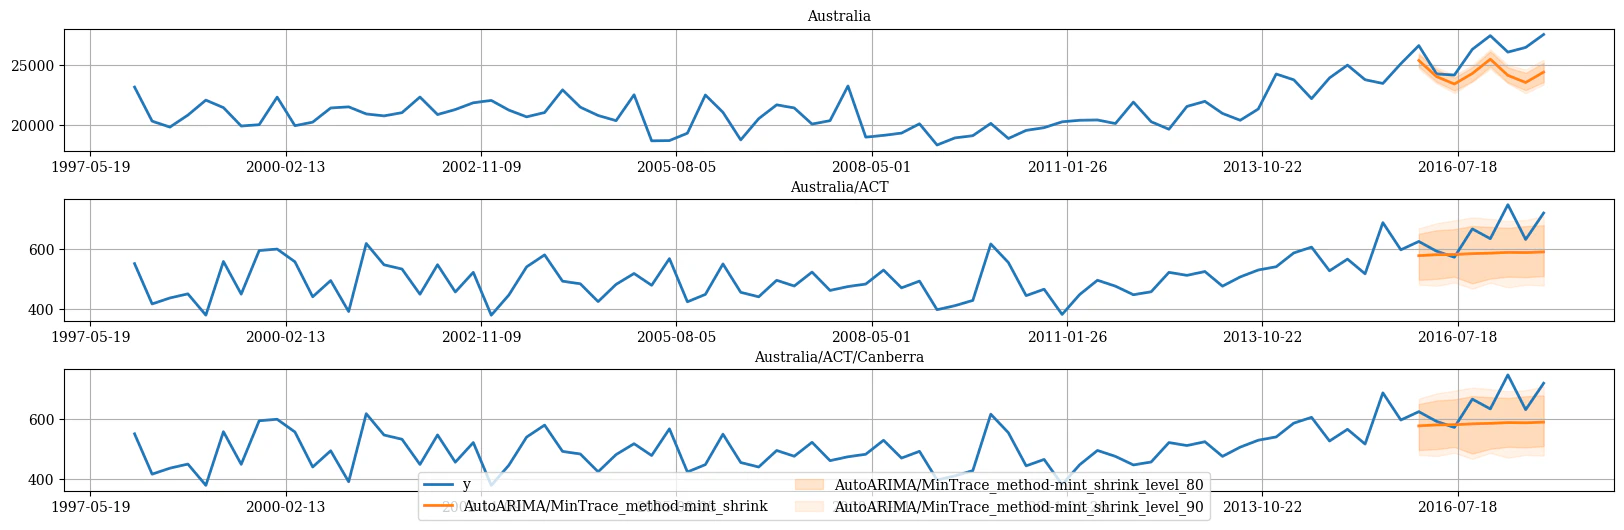
Then we can plot the probabilist forecasts using the following function.Plot single time series
Plot hierarchichally linked time series
References
- Hyndman, R.J., & Athanasopoulos, G. (2021). “Forecasting: principles and practice, 3rd edition: Chapter 11: Forecasting hierarchical and grouped series.”. OTexts: Melbourne, Australia. OTexts.com/fpp3 Accessed on July 2022.
- Shanika L. Wickramasuriya, George Athanasopoulos, and Rob J. Hyndman. Optimal forecast reconciliation for hierarchical and grouped time series through trace minimization.Journal of the American Statistical Association, 114(526):804–819, 2019. doi: 10.1080/01621459.2018.1448825. URL https://robjhyndman.com/publications/mint/.